
For centuries Jews have discussed — and yes, argued — their way through the meanings and interpretations of the weekly Torah portion. Commentary has piled up generation after generation, shaping how Jews understand the text and each other. But not all Torah portions were created equal. Some verses became magnets for debate and interpretation, while others drew relatively little attention. Until now, that imbalance was something readers could sense but never see. For the first time in nearly 2,000 years, it’s visible which Torah passages drew the most sustained Jewish attention.
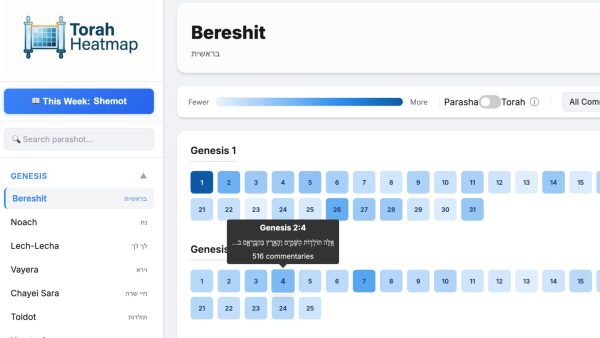
That’s the idea behind TorahHeatMap.org, a new digital project created by Rabbi Daniel Bogard of Central Reform Congregation in St. Louis. The site transforms centuries of Jewish commentary into visual heat maps, revealing where interpreters lingered, argued and returned again and again.
Where the idea began
Bogard traces the project back to his weekly Parashat Hashavua class, which he has long taught by placing commentaries in conversation with one another, an approach inspired by Nechama Leibowitz.
“I fundamentally understand Torah not as an ancient compendium of answers, but as a conversation through time and space about how we are supposed to live the very few days we have on this planet,” Bogard said. “Torah study offers the opportunity to engage with humans living on the boundary of the Iron Age and at the boundary of the artificial intelligence age.”
Over time, he noticed a persistent challenge. Commentary was not evenly spread across a Torah portion. Instead, discussion clustered around a handful of verses, pulling generations of interpretation toward them “like magnetic poles,” while other verses passed with little attention.
ADVERTISEMENT
“I’ve long wanted a quick way of identifying which verses these are,” he said. “But there wasn’t a tool out there for me.”
The first “aha” moment
That changed with the arrival of new AI-assisted coding tools. Using what Bogard calls “vibe coding,” he went from idea to working heat map in about 20 minutes. Over the next few days, he refined the project, adding filters for different commentators, time periods and genres and making the tool fast and usable enough for everyday study.
The results were immediately revealing. Sometimes the most commented-on verses are the ones readers expect, moments of high drama or narrative turning points. But often they are not.
“Sometimes it’s a seemingly random verse where Rashi jumps in with a grammatical note,” Bogard said. “That then inspires dozens of commentaries and arguments over the next thousand years.”
Patterns emerge quickly. The opening verse of a Torah portion almost always draws the most commentary. Verses toward the end often do not.
“Watching how verses toward the end of parashiyot get short shrift is maybe the funniest thing,” he said, comparing it to the Zohar, where later sections seem to lose momentum.
What the patterns reveal
For Bogard, those patterns are not just textual curiosities. They say something about how Jews read, prioritize and engage.
“This sort of mind-blowing reevaluation is always the goal of study,” said Bogard. “There’s no better feeling than having a glimpse into a different way of seeing the world.”
He is clear about what the project is not. “I don’t do the Protestant move. I don’t believe that the text we call the Torah—Jewish literature from roughly 2,500 years ago—should be more valued than Jewish literature of any other time,” Bogard added.
He hopes TorahHeatMap.org makes it easier for anyone with desire to enter the conversation. Instead of being overwhelmed by the scale of traditional sources, users can begin with a visual sense of where Jewish attention has already gathered.
The project cost him $22, mostly for registering domain names. Two years ago, he said, it would have taken months. Decades ago, a lifetime. Now, he hopes it becomes a starting point for the next round of Jewish argument and conversation.
| RELATED: More D’var Torah